Troubleshooting Threads with GDB
Jun 19, 2021
A few posts ago, I raved about the benefits of using asynchronous programming over threads due to the difficulty in designing and troubleshooting a multi-threaded system. But what if you find yourself using threads? How can you understand problems like deadlock, thread priorities, and thread interactions in your application?
One really simple (yet still powerful) way is through gdb, the GNU debugger. By attaching to a running program or by analyzing a core file, it is able to tell you tons of information about a thread. I'll just go into one application of it in this blog post, one that I used recently in my work to get myself out of a sticky situation.
The actual situation that I had to debug was fairly complex, so I won't include all of the code here. However, what it came down to was a few threads which were deadlocked. One thread had locked a shared resource and was waiting for a second thread to release a second shared resource. The second thread was waiting on the first thread to release its shared resource before it continued. Needless to say, neither thread got what it needed to and eventually event queues filled up and crashed the entire program.
The deadlock can be exemplified in the following C++ program. In this program, the shared resource is a string which is printed to the screen. Four threads are created. Three of the threads simply output the previous thread's message and create their own message for the next thread to print. The fourth thread calls the 'ruin_everything' method, which locks the shared resource and then loops forever, never unlocking the resource. This eventually causes a deadlock-like situation. Here's the code:
1
2
3
4
5
6
7
8
9
10
11
12
13
14
15
16
17
18
19
20
21
22
23
24
25
26
27
28
29
30
31
32
33
34
35
36
37
38
39
40
41
42
43
44
45
46
47
48
49
50
51
52
53
54
55
56
57
58
59
60
61
62
63
64
65
66
67
68
#include <iostream>
#include <mutex>
#include <sstream>
#include <string>
#include <thread>
// Define the shared resource (the string to output to the screen
// and the lock used to guard the shared resource.
std::string screen_output("I got here first!");
std::mutex screen_output_mutex;
// Define two functions which each thread will run
// Locks the shared resource, prints the current message, and
// updates the message for the next thread to print.
void print_and_update_msg(const int thread_num)
{
while(true)
{
// Sleep for an amount of time corresponding to the
// thread_num. Just used to order threads in repeatable
// way for this example.
std::this_thread::sleep_for(std::chrono::seconds(thread_num));
// Lock shared resource
std::lock_guard<std::mutex> guard(screen_output_mutex);
// Print and update message
std::cout << "Thread " << thread_num << ": "
<< screen_output << std::endl;
std::stringstream sstream;
sstream << "Thread " << thread_num << " wuz here!";
screen_output = sstream.str();
}
}
// Locks the shared resource and then loops forever. This never
// unlocks the shared resource, so it will cause a deadlock-like
// situation.
void ruin_everything(const int thread_num)
{
// Sleep for amount of time corresponding to the thread_num.
// Only needed for repeatable example.
std::this_thread::sleep_for(std::chrono::seconds(thread_num));
// Lock the shared resource and loop forever
std::lock_guard<std::mutex> guard(screen_output_mutex);
while(true)
{
}
}
// Main function
int main()
{
// Create four threads. Thread four is the bad egg.
std::thread t1(print_and_update_msg, 1);
std::thread t2(print_and_update_msg, 2);
std::thread t3(print_and_update_msg, 3);
std::thread t4(ruin_everything, 4);
// Wait for threads to complete (they never will)
t1.join();
t2.join();
t3.join();
t4.join();
}
What this gets you is a program that prints five lines and then loops forever:
Thread 1: I got here first!
Thread 2: Thread 1 wuz here!
Thread 1: Thread 2 wuz here!
Thread 3: Thread 1 wuz here!
Thread 1: Thread 3 wuz here!
...
So what happened?
- Thread 1 woke up and printed the current message. Then it updated the message to say that it 'wuz here'.
- Thread 1 and 2 woke up at the same time. Thread 2 won the race and locked the message. It printed thread 1's message and updated it to be its own.
- Thread 1 (which was waiting for the shared resource during thread 2's updates) now gets the shared resource, prints thread 2's message and updates it for itself.
- Thread 3 wakes up and contents with thread 1 for the shared resource. Thread 3 wins, prints and updates the message.
- Thread 1 now locks the shared resource, prints thread 3's message and updates the message for itself.
- Thread 4 finally wakes up, locks the shared resource, and then enters its never-ending while loop. It will stay here until the program is manually ended.
This program isn't so hard to reason through. But what about more complex problems? That's where gdb comes in handy.
The -p option allows gdb to attach to a specific, running process ID.
First, find the running process ID with the ps command:
ps -ef | grep <prog_name>
My program was named 'test', so my output was:
chris       4480    3894 73 21:24 pts/0    00:00:11 ./test
chris       4487    3894  0 21:24 pts/0    00:00:00 grep --color=auto test
Using a process ID of 4480, I can attach to my deadlocked program:
chris@desktop:/proj/skratch$ sudo gdb test -p 4480

GNU gdb (Ubuntu 9.2-0ubuntu1~20.04) 9.2
Copyright (C) 2020 Free Software Foundation, Inc.
License GPLv3+: GNU GPL version 3 or later
This is free software: you are free to change and redistribute it.
There is NO WARRANTY, to the extent permitted by law.
Type "show copying" and "show warranty" for details.
This GDB was configured as "x86_64-linux-gnu".
Type "show configuration" for configuration details.
For bug reporting instructions, please see:
<http://www.gnu.org/software/gdb/bugs/>.
Find the GDB manual and other documentation resources online at:
    <http://www.gnu.org/software/gdb/documentation/>.

For help, type "help".
Type "apropos word" to search for commands related to "word"...
Reading symbols from test...
(No debugging symbols found in test)
Attaching to program: /proj/skratch/test, process 4480
[New LWP 4481]
[New LWP 4482]
[New LWP 4483]
[New LWP 4484]
[Thread debugging using libthread_db enabled]
Using host libthread_db library "/lib/x86_64-linux-gnu/libthread_db.so.1".
__pthread_clockjoin_ex (threadid=139760597890816, thread_return=0x0, clockid=<optimized out>, abstime=<optimized out>, block=<optimized out>) at pthread_join_common.c:145
145	pthread_join_common.c: No such file or directory.
(gdb)
Make sure to use 'sudo' or you will not be able to attach to a running program.
At the bottom of the previous code block is the text (gdb). This is the GNU debugger prompt. To
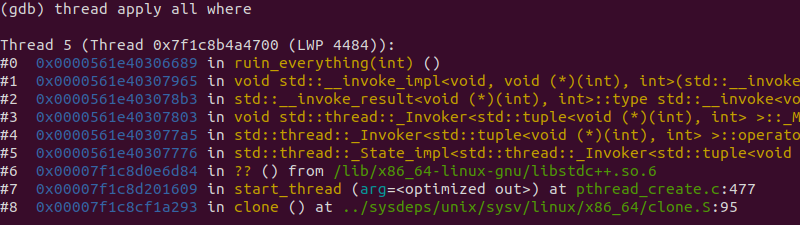
get information on the currently running threads, type thread apply all where.
It will dump a ton of information, even in a small program like the example above. Below is the
information for each thread, starting with Thread 5:
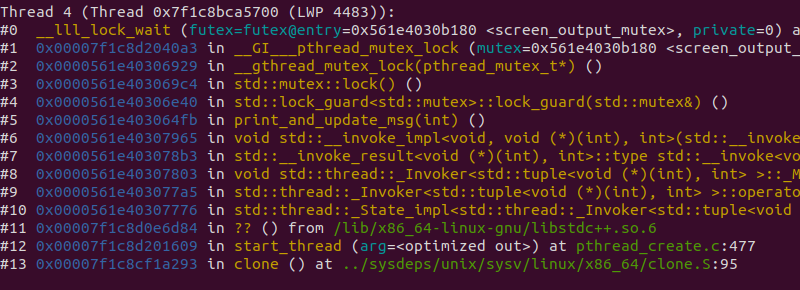
Thread 4:
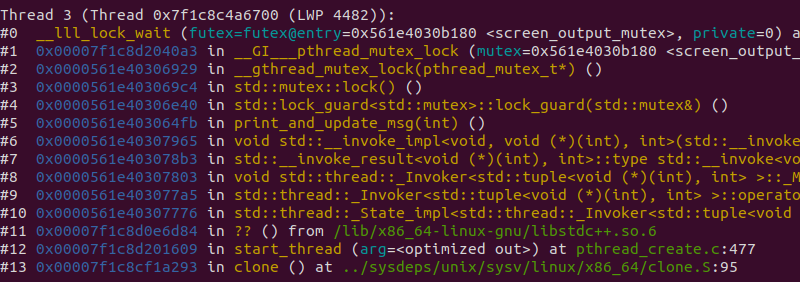
Thread 3:
Threads 2 and 1:
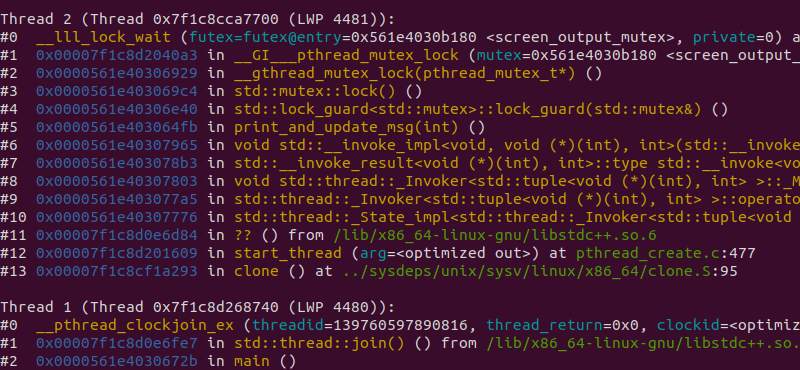
While the example is running, five threads are active. Each thread shows a backtrace of the call
stack that got them to the currently executing function. For example, thread 1 is currently
executing line 0: __pthread_clockjoin_ex, an OS library call. That might not
sound familiar. However, its caller on line 1, std::thread::join() is something
that we actually coded in our main function. Now we know the main function is stuck on the join
calls.
Look at the backtraces for the other threads. You'll notice that Thread 2 through Thread 4 are
running our print_and_update_msg() function. The currently executing line of code
for all three is the attempt to lock the shared resource. Thread 5, on the other hand, is still
happily executing its ruin_everything() function. This is suspicious. If you were
unable to reason through this example, this would at least tell you which function is holding the
lock for the shared resource and blocking all the other threads. In a more complicated example,
this could help to narrow it down to a single function in a codebase of millions of lines of code.
The thread apply all where command can be run post-mortem as well. If a core file
was generated as a result of the unfortunate thread interaction, gdb can be run with:
gdb <prog_name> <core>
Once at the gdb prompt, the thread dump can be done in the same way as with a running program. This also has the added benefit of not needing to be run as 'sudo'. For an introduction on how to get an executable to generate a core file, see this Stack Overflow question.
Finally, I'd like to leave you with a nifty little command which runs the previous command and outputs the results into a file without needing to enter the gdb prompt:
gdb -ex 'thread apply all where' <prog_name> <core> -batch >! thread_dump.txt
Now you'll be a thread-troubleshooting pro!